
Enabling a new physiological signal in the dense clinical interface
Enabling a new physiological signal in the dense clinical interface
Details have been anonymized due to NDA.
Details have been anonymized due to NDA.
Timeline
Timeline
Q3 2024 - Q2 2026
Q3 2024 - Q2 2026
Role
Role
Product Designer
Product Designer
Summary
Summary
The Contractility Graph is a product enhancement that gives clinicians a new view of gastrointestinal contractile activity. I worked with engineers, human factors, and business stakeholders to translate device-captured data into an interactive clinical interface.
Following FDA clearance, I initiated a company-wide product lifecycle workshop, showing how the product evolved from R&D and clinician research through design handoff and FDA submission. The workshop informed future roadmap decisions and product development.
The Contractility Graph is a product enhancement that gives clinicians a new view of gastrointestinal contractile activity. I worked with engineers, human factors, and business stakeholders to translate device-captured data into an interactive clinical interface.
Following FDA clearance, I initiated a company-wide product lifecycle workshop, showing how the product evolved from R&D and clinician research through design handoff and FDA submission. The workshop informed future roadmap decisions and product development.
Impact
Impact
Enabled the launch of an FDA-cleared clinical feature
Enabled the launch of an FDA-cleared clinical feature
Aligned engineering, business, and clinical stakeholders around user needs
Aligned engineering, business, and clinical stakeholders around user needs
Extended the design system for future product development
Extended the design system for future product development
PROBLEM AREA
PROBLEM AREA
Data Hierarchy:
Making room for a new signal
Data Hierarchy:
Making room for a new signal
Introducing a new signal into an FDA-cleared medical product meant working within an validated interface. The challenge was to add the new graph without disrupting the clinical information clinicians already relied on.
This is our exiting FDA-cleared interface. Everything grey was locked, and one green zone left room to work on. That's where the signal went.
Introducing a new signal into an FDA-cleared medical product meant working within an validated interface. The challenge was to add the new graph without disrupting the clinical information clinicians already relied on.
This is our exiting FDA-cleared interface. Everything grey was locked, and one green zone left room to work on. That's where the signal went.

MVP
MVP
First concept: Introducing the new signal
First concept: Introducing the new signal
My first mock up introduced the new trace as a third panel stacked at the bottom. This can be achieved with the minimum development effort, but the size of each graph would be compromised.
My first mock up introduced the new trace as a third panel stacked at the bottom. This can be achieved with the minimum development effort, but the size of each graph would be compromised.

No additional interaction required
No additional interaction required
Everything is always available
Everything is always available
Conflicting hierarchy. Primary traces should occupy the most space
Conflicting hierarchy. Primary traces should occupy the most space
User Research
User Research
User interview changed the direction
User interview changed the direction
Validating clinician’s needs for the data hierarchy:
Along with the PM, I conducted formative evaluation with clinicians across community, veteran, and tertiary hospitals. The research showed that primary traces were non-negotiable, while clinicians considered the new graph more valuable than the existing secondary traces. They still wanted the secondary traces available when needed.
Validating clinician’s needs for the data hierarchy:
Along with the PM, I conducted formative evaluation with clinicians across community, veteran, and tertiary hospitals. The research showed that primary traces were non-negotiable, while clinicians considered the new graph more valuable than the existing secondary traces. They still wanted the secondary traces available when needed.


Clinicians strongly preferred the Contractility Graph, particularly its colored visualization.
Clinicians strongly preferred the Contractility Graph, particularly its colored visualization.
CUSTOMER QUOTES
Based on my experience with other techniques, I hardly ever go back to line trace, and I was so pleased to see the colored plots.
Based on my experience with other techniques, I hardly ever go back to line trace, and I was so pleased to see the colored plots.
Clinician - Tertiary Hospital
Clinician - Tertiary Hospital
Colored plots are really helpful because I can easily transfer the information to the patient.
Clinician - Community Private Practice
Colored plots are really helpful because I can easily transfer the information to the patient.
Clinician - Community Private Practice
I translated customer feedback into defined design inputs with the verification team, including customer and system requirements. I then worked with developers to ship the approved design from UI specifications, while partnering with a human factors specialist on validation activities to evaluate its impact alongside the existing interface.
I translated customer feedback into defined design inputs with the verification team, including customer and system requirements. I then worked with developers to ship the approved design from UI specifications, while partnering with a human factors specialist on validation activities to evaluate its impact alongside the existing interface.
DESIGN SYSTEM
DESIGN SYSTEM
Defining a new interaction pattern
Defining a new interaction pattern
To make the Contractility Graph and secondary traces interchangeable, I evaluated existing interaction patterns against the required behavior.
To make the Contractility Graph and secondary traces interchangeable, I evaluated existing interaction patterns against the required behavior.


No Interaction
Toggle


Overlay visually conflicts with existing data
Checkbox
An exiting control for hide/show of data
Overlay visually conflicts with existing data
Radio Button
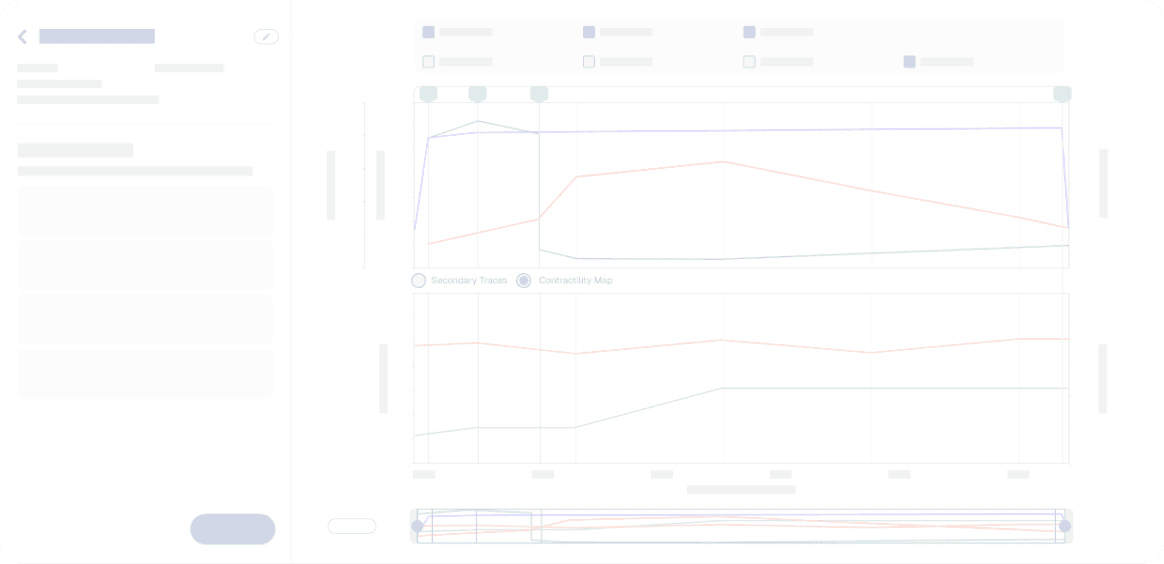
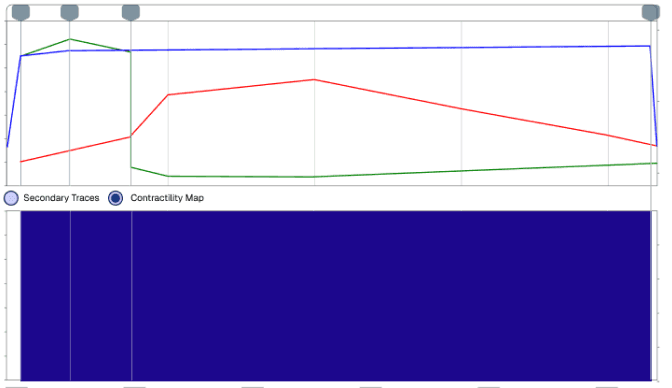
An exiting control for selection
Breaks the visual correlation for top and bottom graphs
Dropdown
Dropdown

An exiting control for selection
Breaks the visual correlation for top and bottom graphs
Requires additional clicks
Toggle
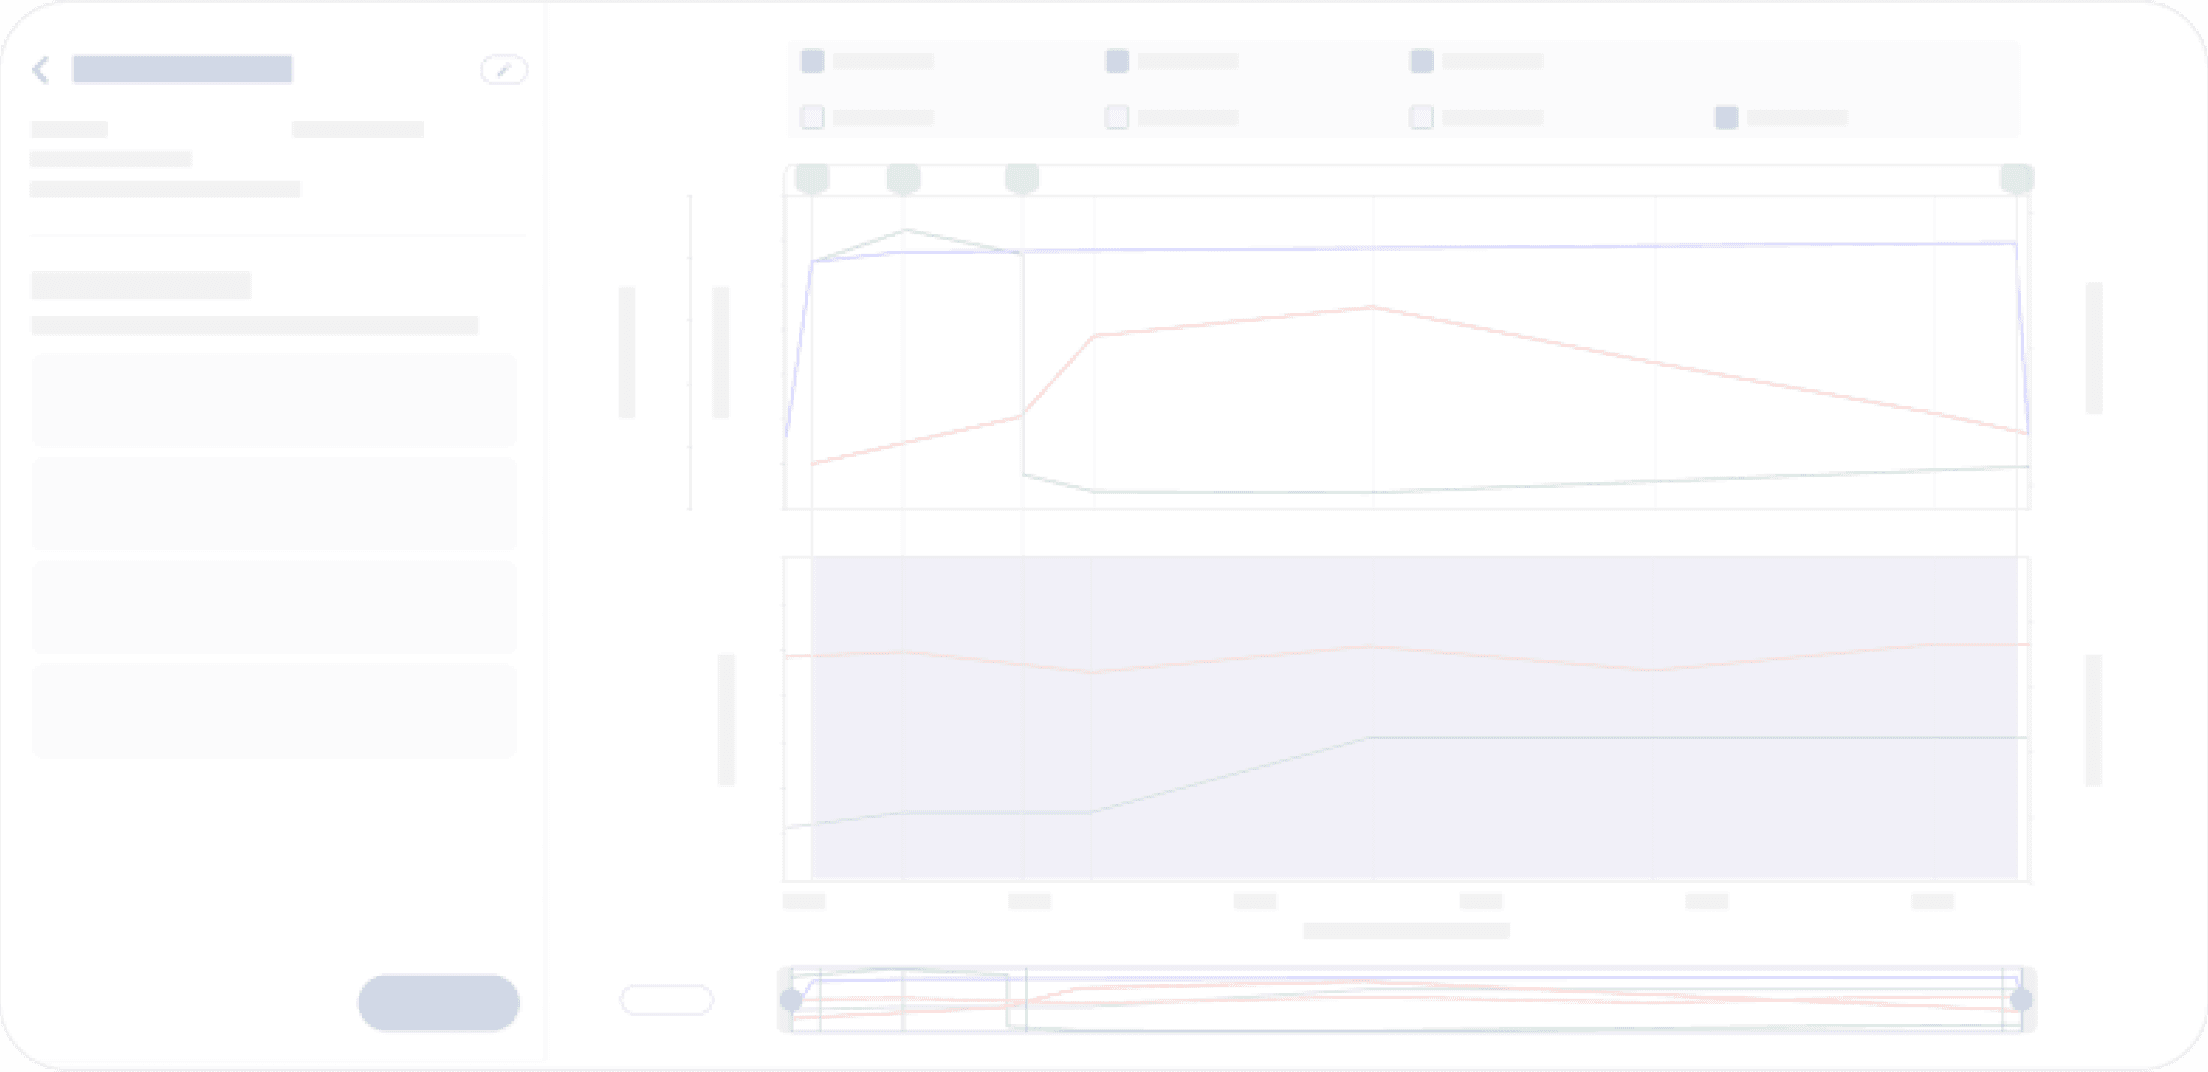

Overlay visually conflicts with existing data
Checkbox
An exiting control for hide/show of data
Overlay visually conflicts with existing data
Radio Button
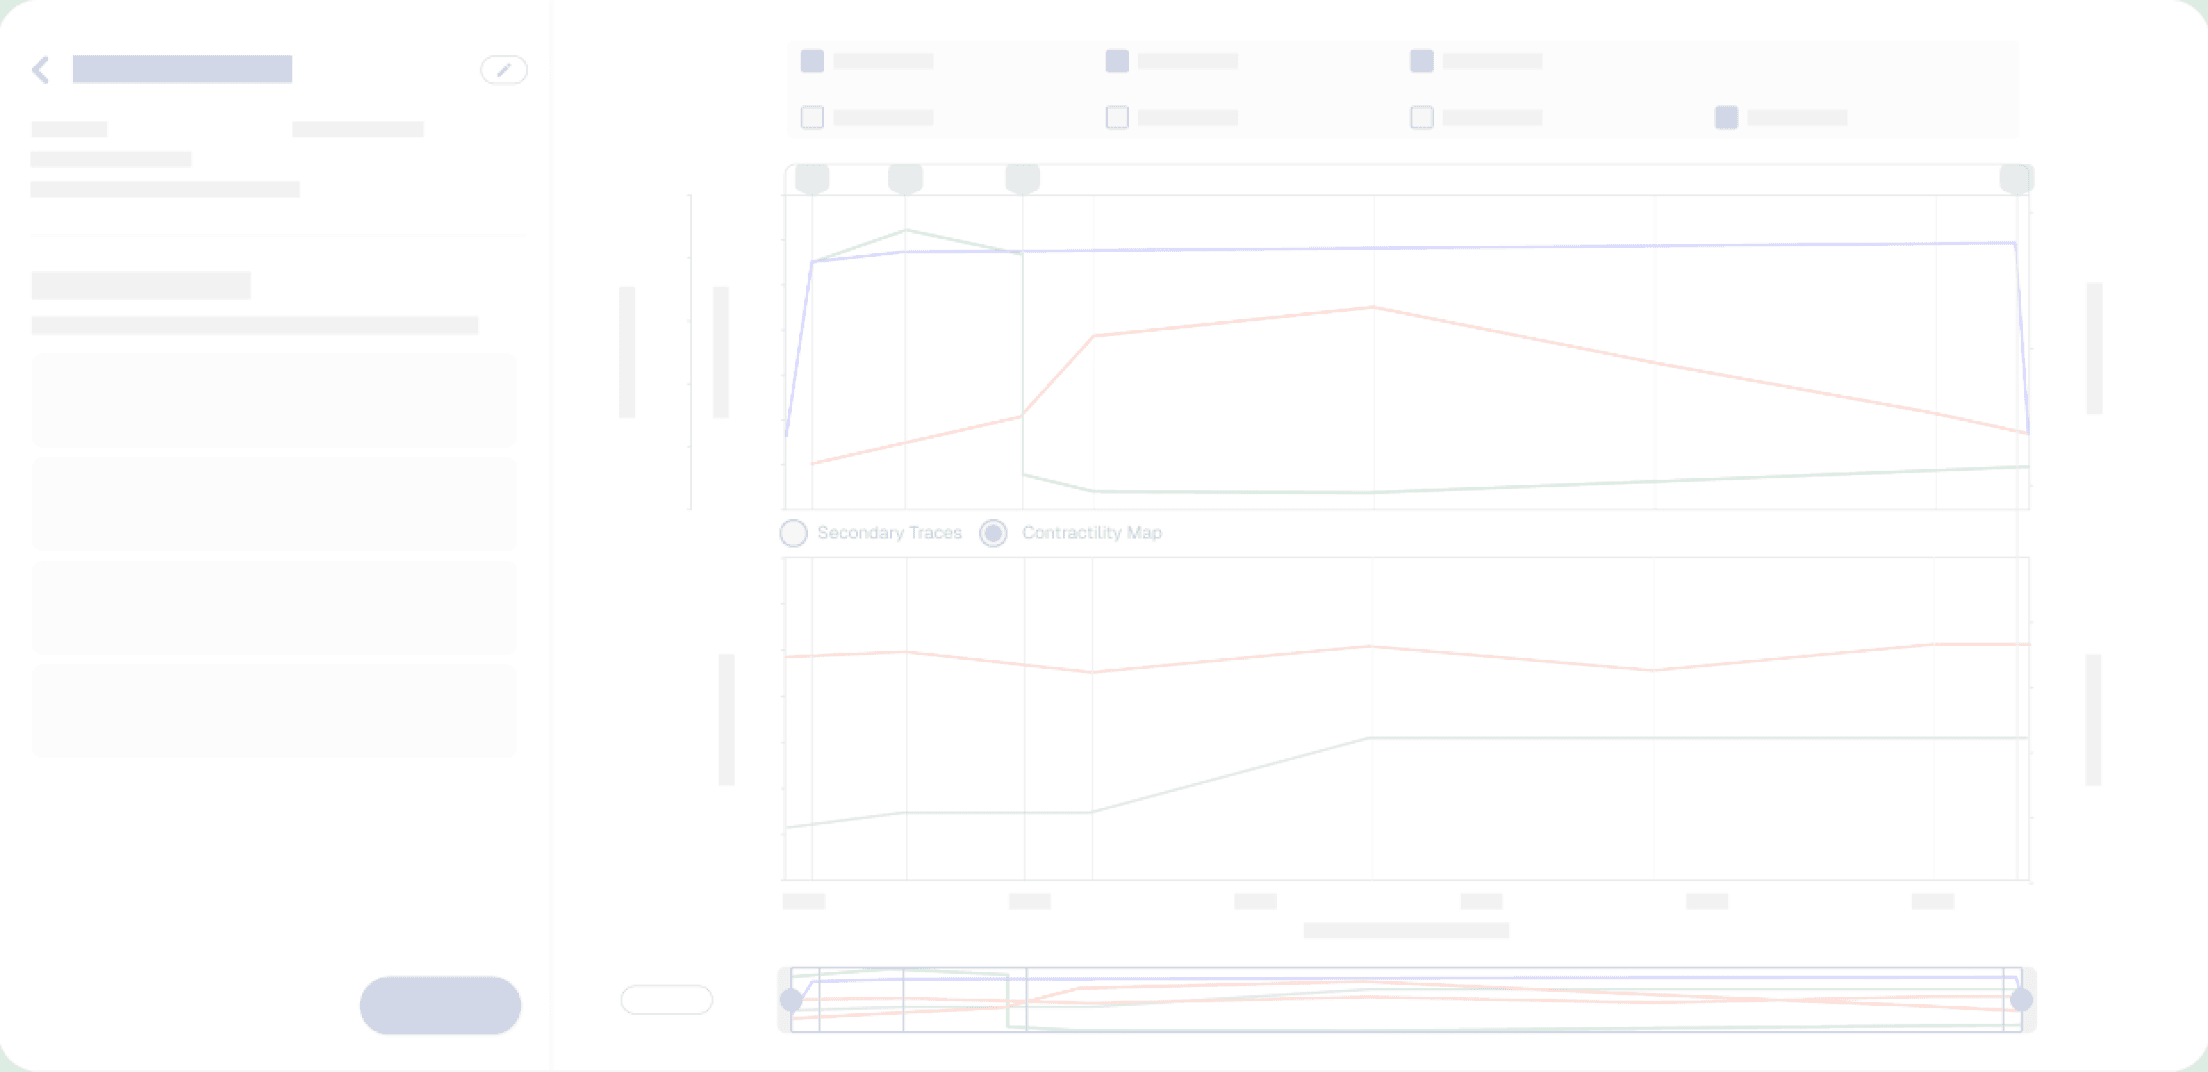

An exiting control for selection
Breaks the visual correlation for top and bottom graphs
Dropdown
Dropdown

An exiting control for selection
Breaks the visual correlation for top and bottom graphs
Requires additional clicks
After evaluating each, I decided to introduce a new element -- the segmented button to enable the toggle action between two graphs to emphasize its particular importance and promote the new feature by isolating it from existing patterns.
After evaluating each, I decided to introduce a new element -- the segmented button to enable the toggle action between two graphs to emphasize its particular importance and promote the new feature by isolating it from existing patterns.

Segmented Button
Option 1
Option 2



Visually promotes the new feature. Easy to find.
Preserves secondary traces
Segmented Button
Option 1
Option 2


Visually promotes the new feature. Easy to find.
Preserves secondary traces

FINAL DESIGN
FINAL DESIGN
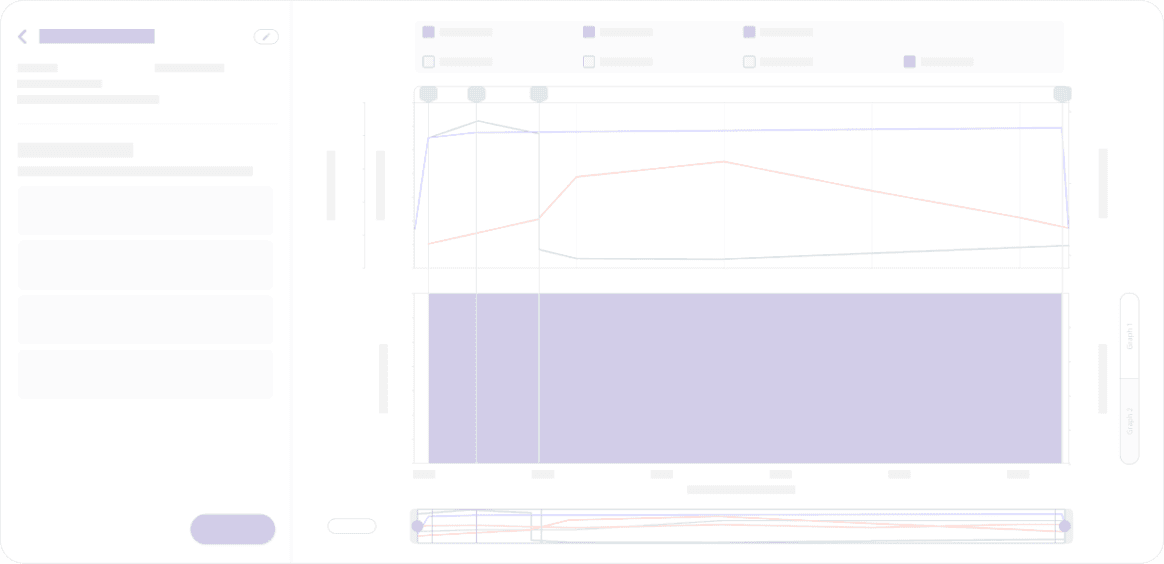
Final concept: toggling between new and existing signal
Final concept: toggling between new and existing signal
I tested the final design with the clinicians, and they find the segmented button easy to use.

CUSTOMER QUOTES
I think this works. The toggle visually gives doctors an additional level of confidence that depict the right spot for decision-making.
I think this works. The toggle visually gives doctors an additional level of confidence that depict the right spot for decision-making.
I think this works. The toggle visually gives doctors an additional level of confidence that depict the right spot for decision-making.
Clinician - Community Private Practice
Clinician - Community Private Practice
Colored plots are really helpful because I can easily transfer the information to the patient.
Clinician - Community Private Practice
I like the toggle feature. Ultimately the success of this technology will come in sort of the uptake and use in the community.
I like the toggle feature. Ultimately the success of this technology will come in sort of the uptake and use in the community.
Clinician - VA Hospital
Impact
Scaling the knowledge: Training Materials
I translated the new feature into training materials and videos to support interpretation and adoption. These were used by clinical users and internal staff.


With the insights I synthesized from clinician interview, I ran a company-wide workshop to build shared empathy and facilitate discussions about the impact on customer's experiences.
IMPACT
Early clinical value after deployment & 2 distinction awards
The Contractility Graph was used by a customer immediately after deployment to refine the interpretation thereby changed patient management.
CUSTOMER QUOTES
We had a customer use the new contractility feature right after deployment this AM to refine landmark significantly changing the gastric emptying time from normal to severe gastric delay and thereby change patient management. It was very helpful.
Staff - Clinical Support
The Contractility Graph also received two Poster of Distinction awards at Digestive Disease Week (DDW), a major international gastroenterology conference.
CROSS-FUNCTIONAL ALIGNMENT
Scaling the knowledge:
Training Materials
Scaling the knowledge:
Training Materials
I translated the new feature into training materials and videos to support interpretation and adoption. These were used by clinical users and internal staff.
I translated the new feature into training materials and videos to support interpretation and adoption. These were used by clinical users and internal staff.
With the insights I synthesized from clinician interview, I ran a company-wide workshop to build shared empathy and facilitate discussions about the impact on customer's experiences.
With the insights I synthesized from clinician interview, I ran a company-wide workshop to build shared empathy and facilitate discussions about the impact on customer's experiences.
IMPACT
IMPACT
Early clinical value after deployment
& 2 distinction awards
Early clinical value after deployment
& 2 distinction awards
The Contractility Graph was used by a customer immediately after deployment to refine the interpretation thereby changed patient management.
The Contractility Graph was used by a customer immediately after deployment to refine the interpretation thereby changed patient management.
CUSTOMER QUOTES
We had a customer use the new contractility feature right after deployment this AM to refine landmark significantly changing the gastric emptying time from normal to severe gastric delay and thereby change patient management. It was very helpful.
We had a customer use the new contractility feature right after deployment this AM to refine landmark significantly changing the gastric emptying time from normal to severe gastric delay and thereby change patient management. It was very helpful.
Staff - Clinical Support
Staff - Clinical Support
The Contractility Graph also received two Poster of Distinction awards at Digestive Disease Week (DDW), a major international gastroenterology conference.
The Contractility Graph also received two Poster of Distinction awards at Digestive Disease Week (DDW), a major international gastroenterology conference.